Ariel
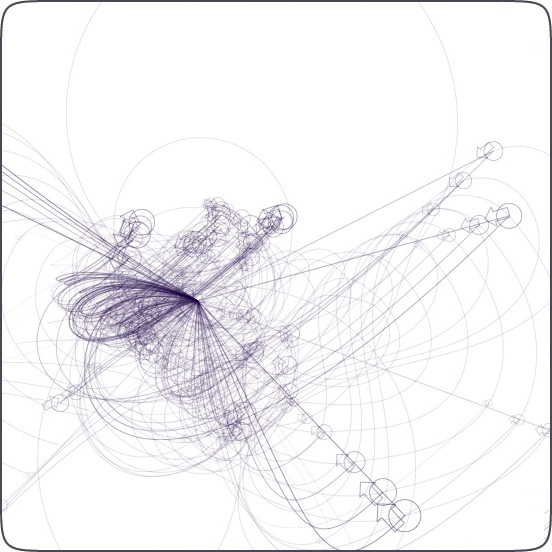
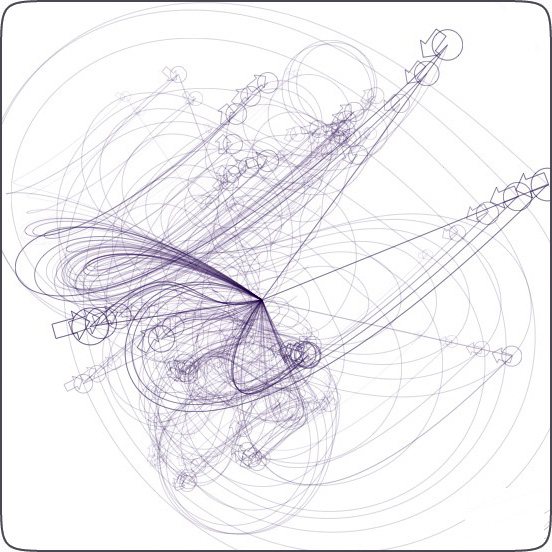
Another example of Boids in NodeBox, this one visualising the flight path of a flock of birds, registering where they where and where they are going. The boids tend to swarm around the center of the composition, like they're trapped in a cage.


Source code:
size(800, 600)

cornu = ximport("cornu")
boids = ximport("boids")

flock = boids.flock(10, 0, 0, WIDTH, HEIGHT)
flock.goal(WIDTH/2, HEIGHT/2, 0)

n = 30
for i in range(n):

    flock.update(shuffled=False)

    points = []
    nofill()
    for boid in flock:

        stroke(0.1,0.0,0.25, 2.5*boid.z/100)
        strokewidth(0.25*boid.z/100)

        r = boid.z/5
        oval(boid.x-r/2, boid.y-r/2, r, r)
        beginpath(boid.x, boid.y)
        curveto(
            boid.y,
            boid.x,
            boid.y,
            boid.y,
            WIDTH/2,
            HEIGHT/2
        )
        endpath()

        push()
        rotate(-boid.angle)
        arrow(boid.x, boid.y, boid.z*0.2)
        pop()
        points.append((boid.x, boid.y))

    # Relativise points for Cornu.
    for i in range(len(points)):
        x, y = points[i]
        x /= 1.0 * WIDTH
        y /= 1.0 * HEIGHT
        points[i] = (x,y)

    stroke(0.1, 0.0, 0.25, 1.5 * float(i)/n)
    strokewidth(0.25)
    cornu.drawpath(points, tweaks=0)
Created by Tom De Smedt


